Environment and land management in most countries entail encouraging good farming practices that ensure sustainable, intensive agriculture, and periodically monitoring and assessing these farming practices. Considering field inspections are time-consuming and cost-intensive, it often calls for a collaborative approach of monitoring farmlands to understand the area of parcel cropped and assess the implementation of farming practices and farm management remotely. With remote analytics, agencies locate farm areas where vegetation and soil health is under stress, either due to poor water supply or non-compliance with best practices. They can help organize field inspections and crew for select high-risk regions and plan mitigation to restore land/ environment health.
The type of crops or vegetation grown on the farm directly impacts the health of the soil and its productivity, which determines its sustainability in future agriculture. Therefore, to achieve the UN’s climate change target of Net Zero by 2050, soil restoration and protection have become core issues in the 2020 Agriculture Bill. The new farming rules for water require following best practices to reduce soil and water erosion.


Figure 1: Solution Components
This covers the iterative process of data extraction, data preparation and validations, model refinement, validations, and finally, pushing to the model registry.
Deployment of the final model and pipeline on Kubernetes.
This step covers training models, feedback looping, and retraining tasks.
This step analyzes the business problem to be solved using ML, designs the overall ML solution, tools, and technology, determines what data and possible sources of data for EDA, trains models, and evaluates the distribution and quality of the data, whether annotated/labeled.
This step covers data transformation rules (normalization, aggregations) and cleaning rules to bring the data into a usable format and defining feature engineering rules such as the calculation of new and more advanced features based on other features and using feedback looping.
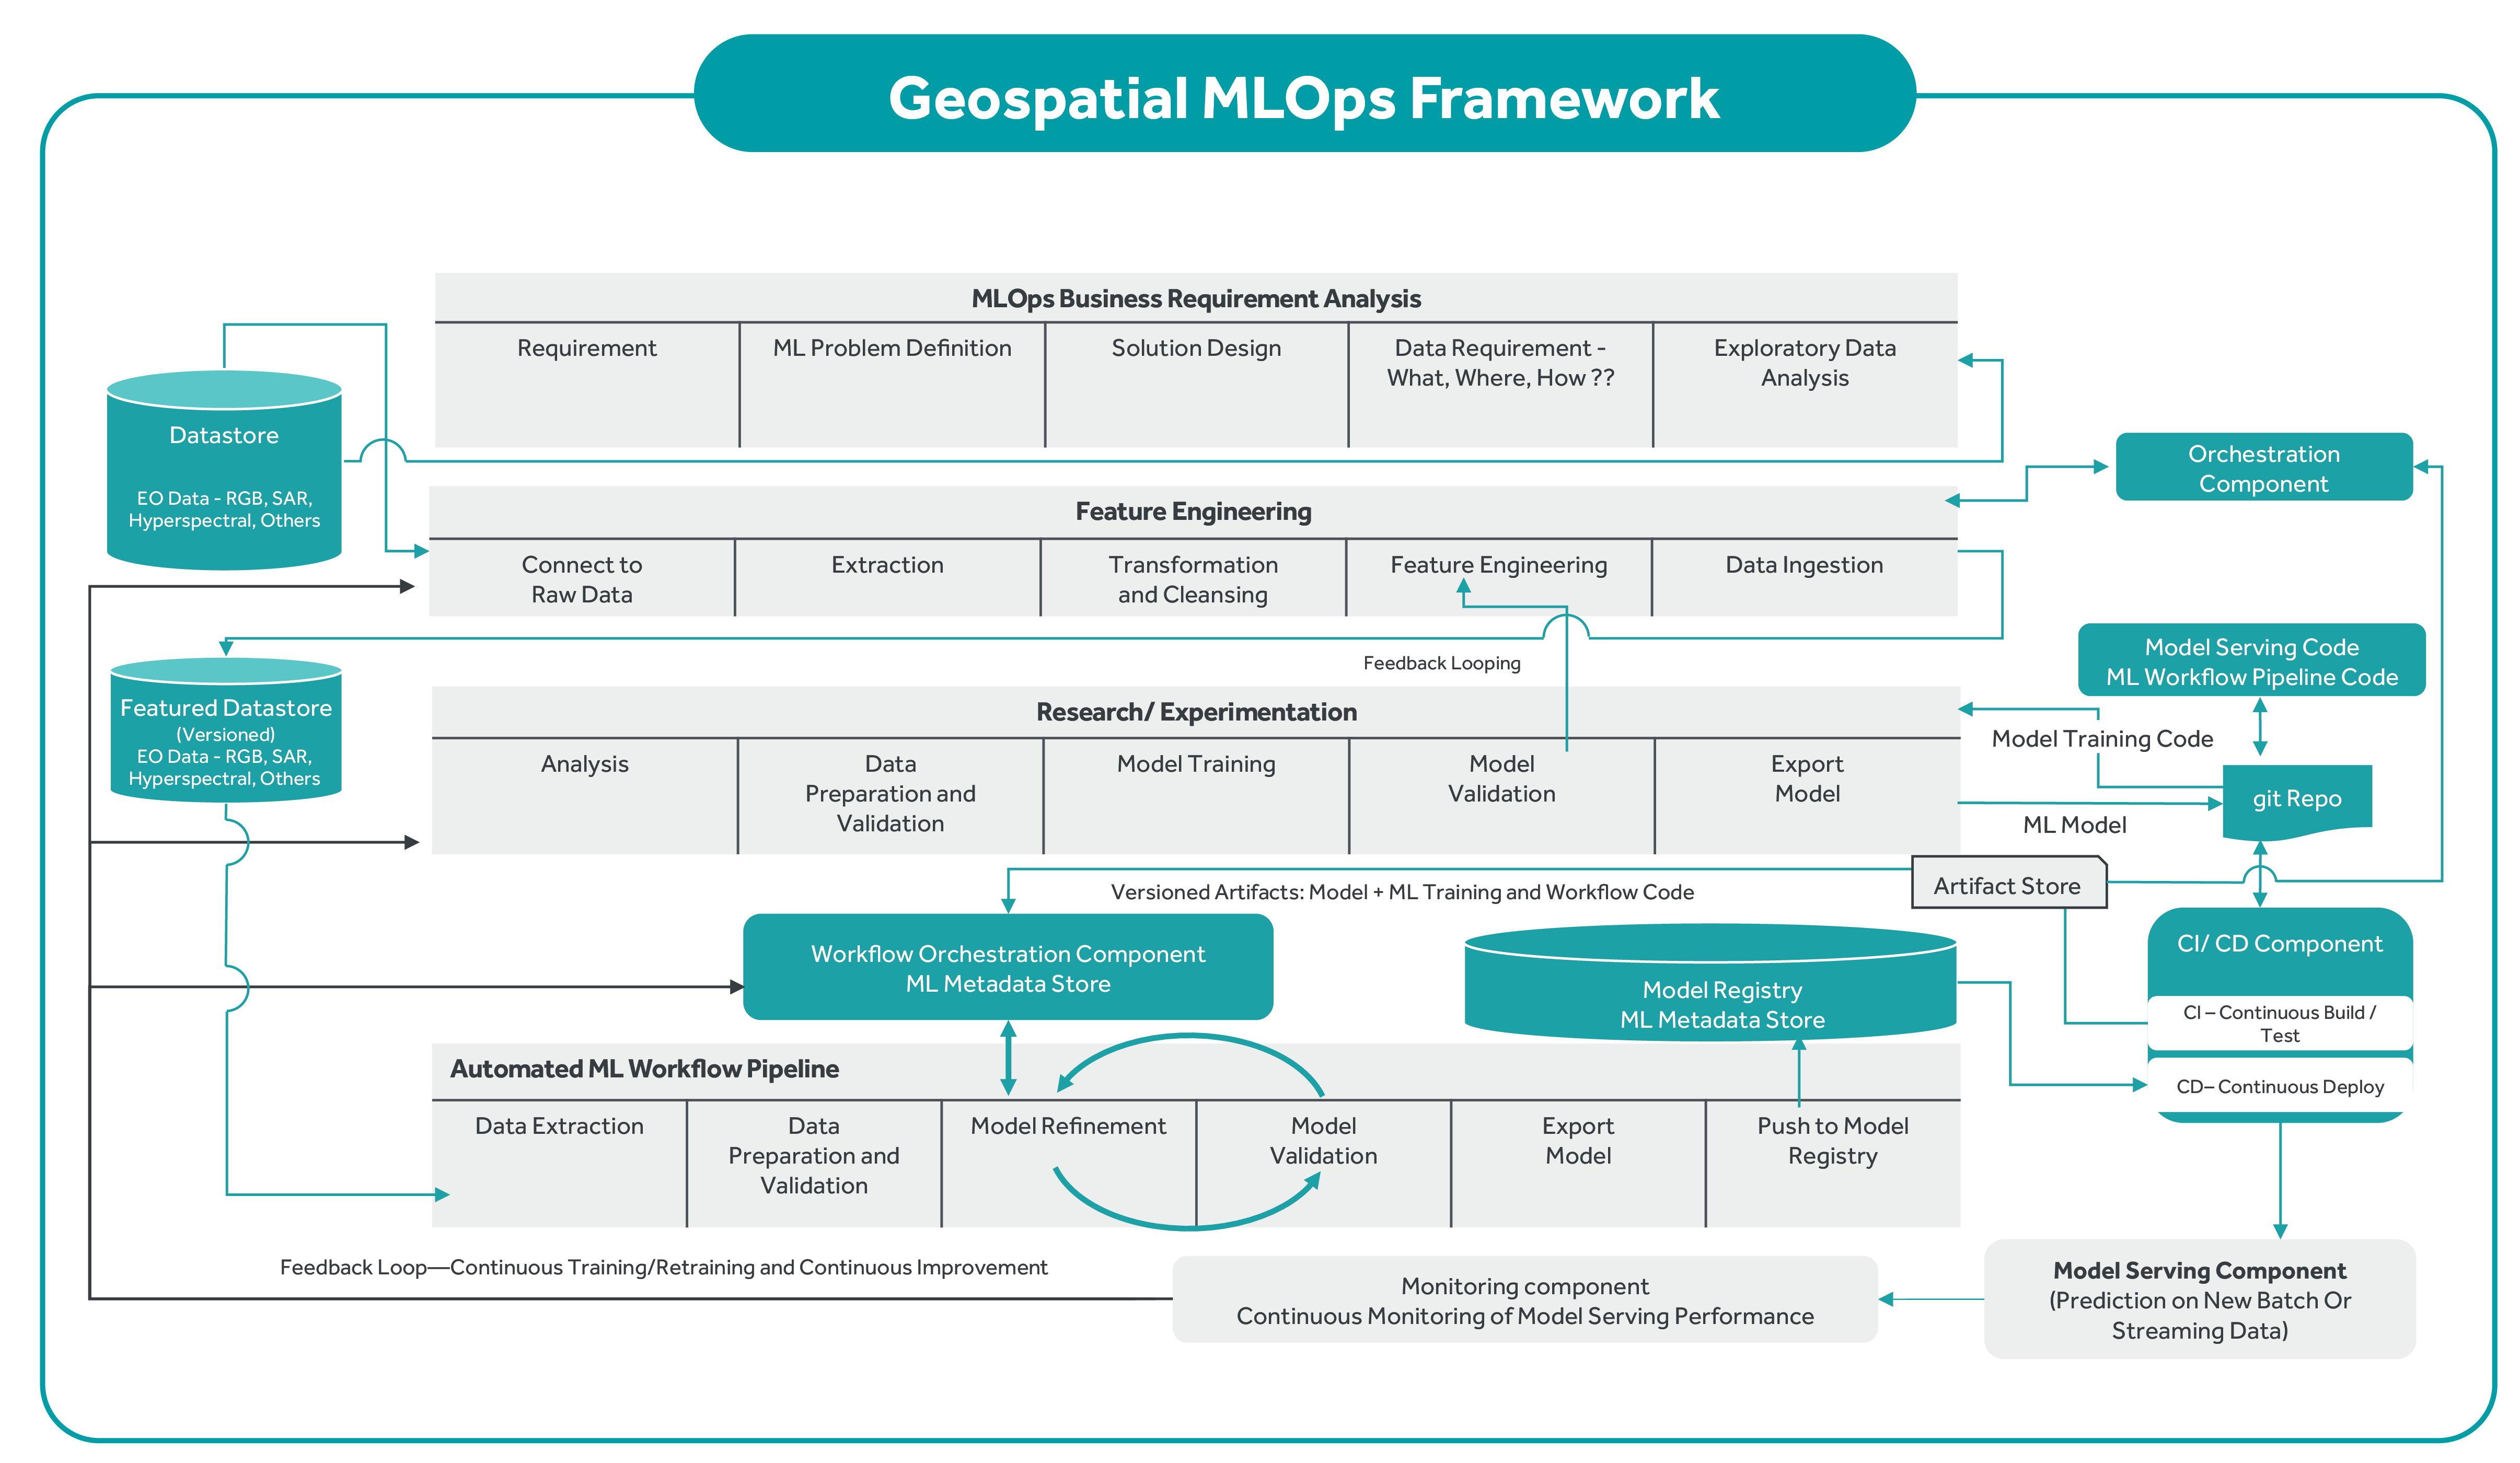
Figure 2: Solution Architecture
A generic open-source MLOps framework with Kubeflow as the core engine or platform on top of Kubernetes is depicted below. It indicates select open-source tools to execute a series of tasks for end-to-end MLOps.
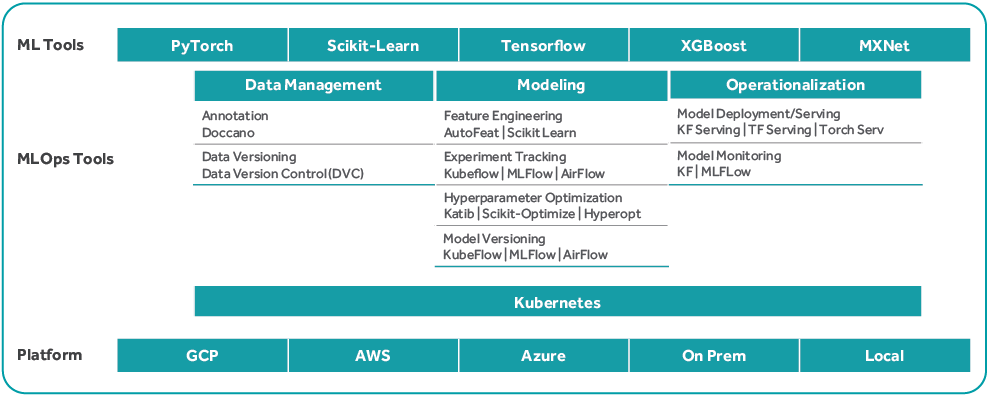
Figure 3: MLOps Framework
Kubeflow builds on Kubernetes as a system for deploying, scaling, and managing an MLOps system. The Kubeflow configuration interfaces help users specify the ML tools required for the workflow. The workflow can be deployed over various clouds, local, and on-premises platforms for experimentation and for production use.

Evaluates the importance of features and creates more advanced models with minimal bias using uniform distribution metrics.

Reduces variation in model iterations and provides resiliency for enterpriselevel scenarios with reproducible learning and models.

Ease of deployment of models on production environment.

Uses dataset registries and advanced model registries to track resources.

Creates audit trails to meet regulatory requirements and automatically trace experiments.

Packs models quickly, ensuring high quality at every step through profiling and model validation.

Provides improved traceability by tracking code, data, and metrics in the execution log; keeps track of version history and model origin to enable auditing.

Uses built-in integration with Azure DevOps or AWS CodeBuild and GitHub actions to plan, automate, and manage workflows efficiently; uses automatic scaling and managed clusters of CPUs and GPUs with distributed learning in the cloud.
Cyient used MLOps using Sentinel 2 Optical Imageries for a marquee government agency to identify crop variety and health. The work entailed satellite-based monitoring with Computer Vision to detect and locate good and healthy farming practices. Keys tasks included:
The Crop Variety Classification and Health Analytics were based on biophysical indicators—NDVI, LAI, and leaf chlorophyll of the plantation—estimated using high-resolution open-source satellite imageries that distinguished each crop species based on the spectral signature of crop phenology. Some of the key vegetation indices thus estimated and reviewed were:
Although the ML-driven analysis generated a noise-free, highly accurate, and consistent output, its dependency on ground truth validation was a major bottleneck. To train and validate the model, ground truths were crucial to classify and evaluate every agricultural zone and identify crop variety. The model helped identify wheat and potato with precision and accuracy.
Seasonal data of the growing period of the crop were considered to assess the vegetation sensitivity of the NIR and Red spectrums; the Red Edge difference index was applied to accentuate the species-wise phenology variance. The Red Edge is a region in the Red-NIR transition zone of the vegetation reflectance spectrum. It marks the boundary between absorption by chlorophyll in the red visible region and scattering due to the internal leaf structure in the NIR region. As a result, this part of the spectrum reflects any slight change in the bio-chemical structure and physical parameters during the plant phenology, either by biomass accumulation or impact of stress.
The crop and stress identifier model was trained over various iterations to improve its performance. The following aspects were considered in refining the training labels:
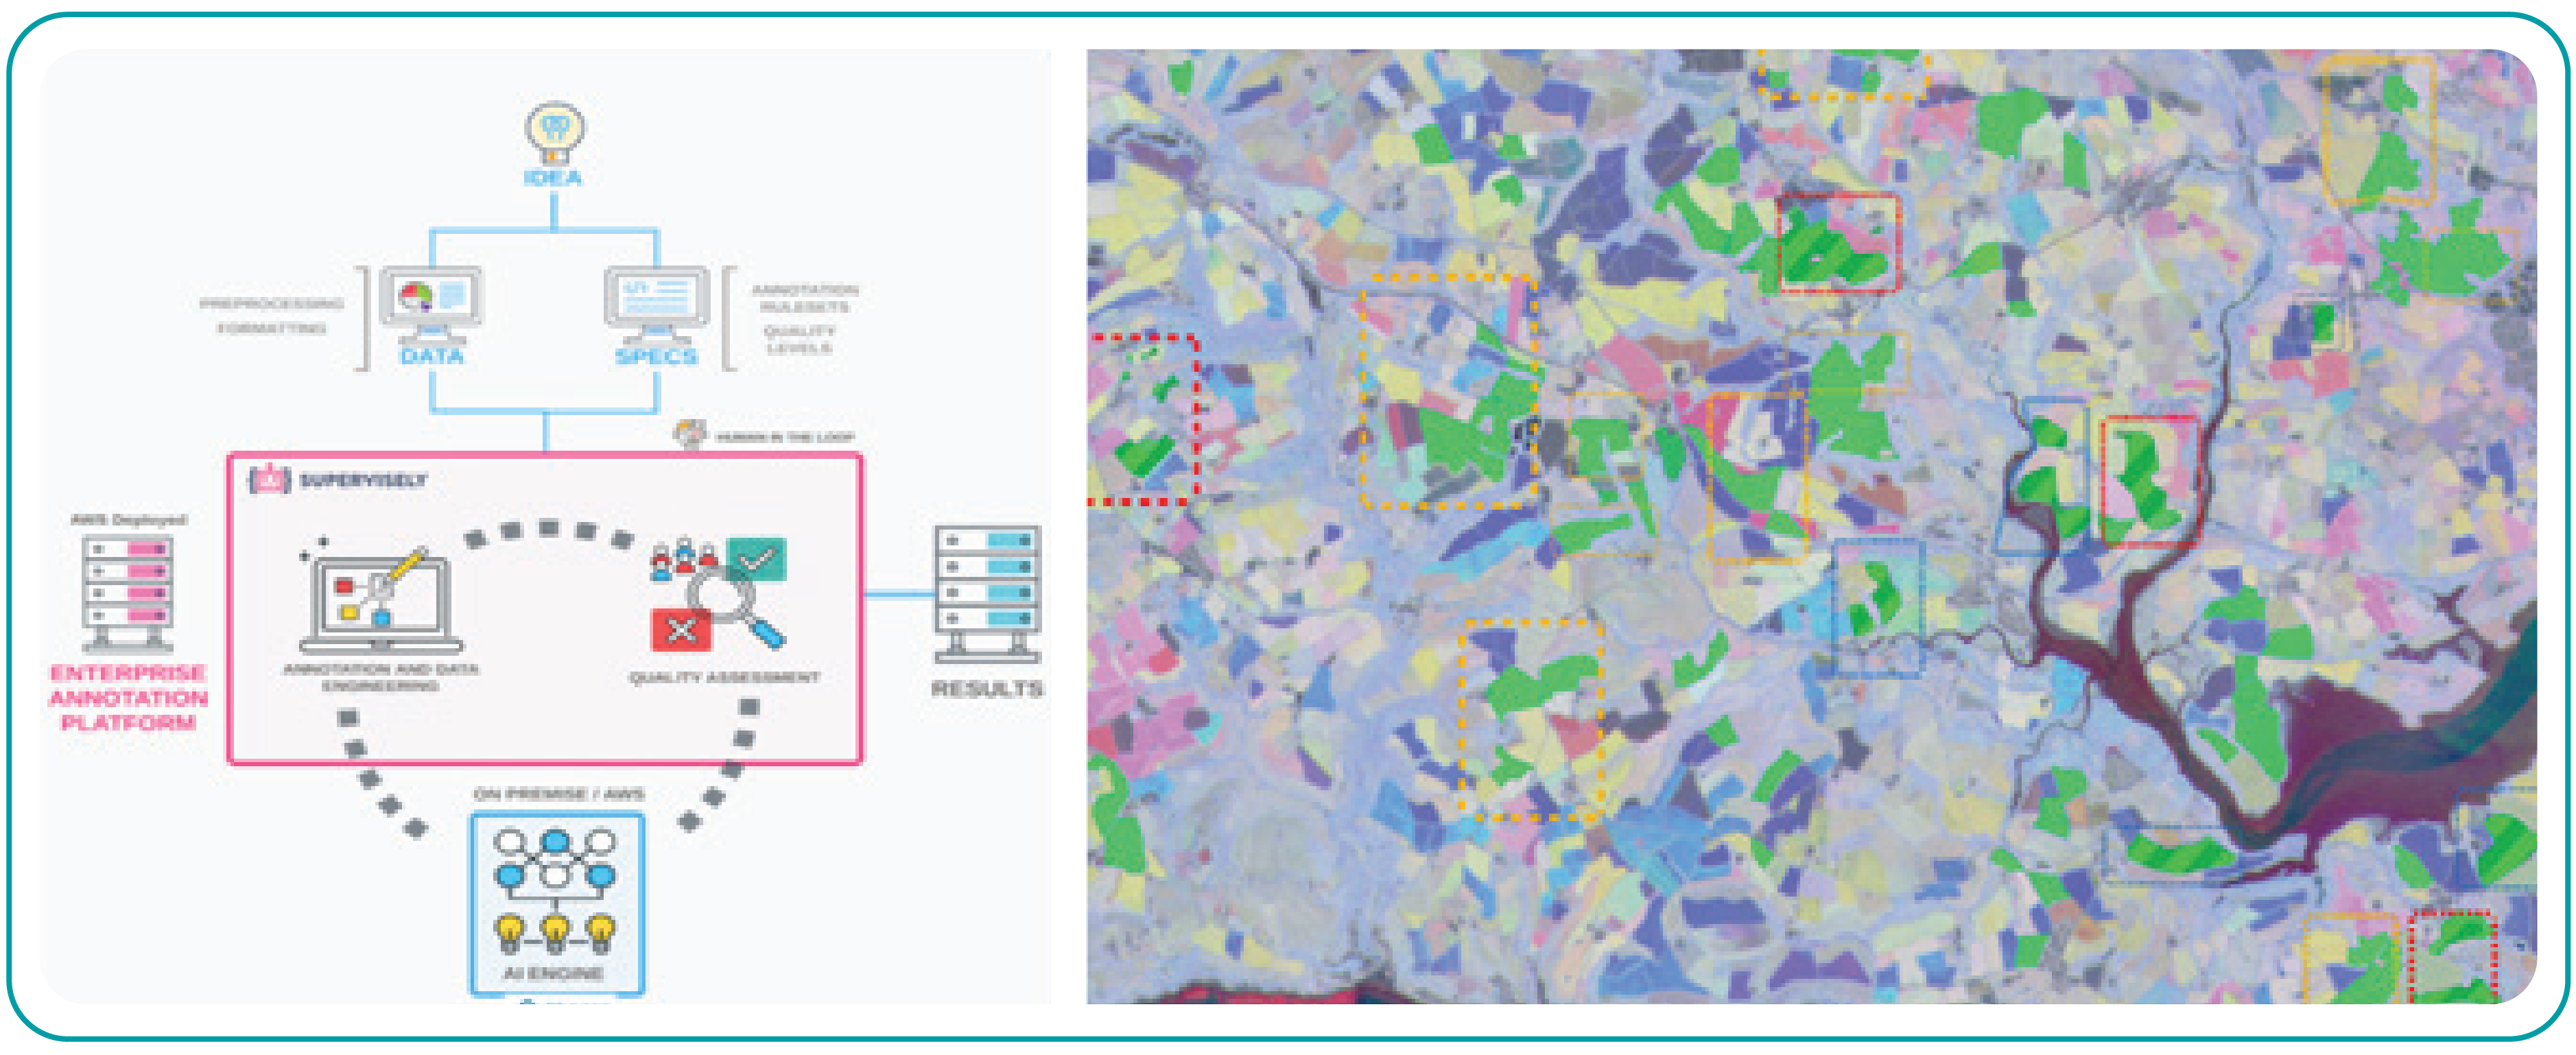
Figure 5: ML- vs. DL-based crop monitoring outcome
The crop classifier/detector was trained to identify crops automatically and predict without any ground truth input. The trained model was deployed and tested in an unknown region to assess its efficacy. The figure above (Fig 5), exhibits the results where the region highlighted in green, points to wheat cultivation. The predicted wheat parcels were validated with the farmers' claim data (highlighted in yellow) and were having a 90% match.
The model was retrained with additional region and variability, and the prediction improved. Figure 5: ML- vs. DL-based crop monitoring outcome Within the project's timeline, Cyient created an annotations library with 1000+ scenarios.
Once generated by the model (either ML or DL), the detected output goes through a visual inspection for QC to guarantee data quality. The existing ML model has accuracy confidence of >85%, and we apply visual quality checks to a certain extent to clean up unwanted polygons and false positives. As per the DL model (accuracy confidence of 86%), more training is required from different geographies to enhance the model's robustness and consistency.

Nihar R. Sahoo heads Geospatial Solutions in the CTO Unit. He has over 23 years of experience in architecting and implementing enterprise geospatial and GeoAI solutions across industries. He provides thought leadership on spatial data science, earth observation, and allied areas.