Creating Grids of the Future: Shift from Spreadsheets to Grid Analytics with a Seamless Integration with GIS Systems
Written by Tareg Ghaoud 14 Jul, 2020
As businesses pivot and align with the new business dynamics and work around the challenges posed by COVID-19, technology is fast emerging as a critical differentiator. Global companies across industries are rapidly adopting digital tools and techniques to optimize operations, ensure business continuity, and prepare for the next phase of recovery and growth. Players in the utility segment, however, are still bound by legacy methods of recording, storing, and analyzing their data. And they are recognizing that to operate and excel in the new normal, the traditional practices and systems for data management will reduce network management operation efficiency while also impacting the cost structures.
Typically, spreadsheets have been used by utilities to process structured data by creating simple logic and analyzing business problems. The use of spreadsheets for data analytics will allow analysts to conduct their analysis independently from the IT team, as they are easy to use and share, and provide users with full control over the logic involved in the analytics and reporting. However, to still be using spreadsheets in today’s digital environment is an archaic way of performing data analytics. Spreadsheets are not live documents, and multiple versions make it challenging to determine if analysts are using the latest one for a specific application. This may also lead to an increasing number of data islands, which can only stress the need for a centralized database and data analytics approach. Moreover, the increased amount of data due to the deployment of smart meters, Phasor Measurement Units (PMU), and other sensing devices will emphasize the need for more sophisticated analytics tools and platforms to overcome the limitations of spreadsheets.
Modern analytics platforms enable the analysis of large volumes of data, with different structures, and near-real-time streams using more advanced algorithms such as time series, rule learning, data mining, cluster analysis, and machine learning. The result is more data insights, more informed decisions, and actions that transform the utility business.
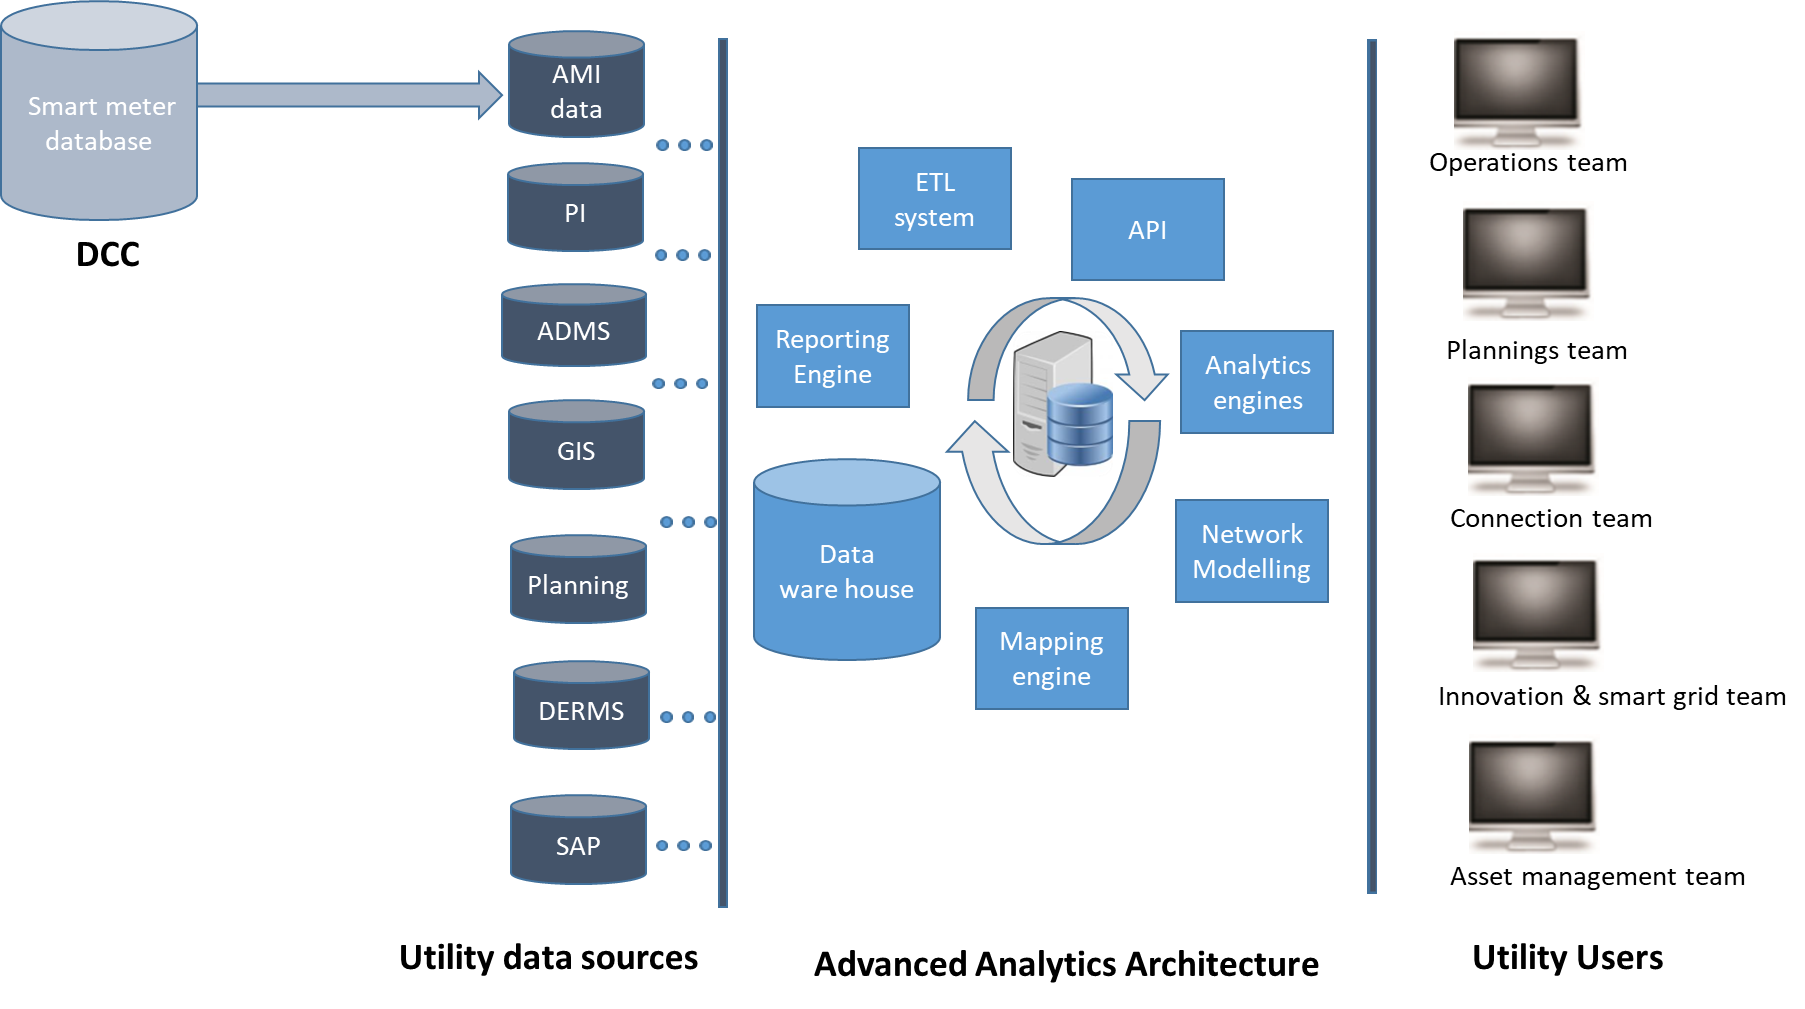
In a grid analytics platform, data moves from the data sources following the data value chain: collection, management, analysis, and action. Data analytics will not be of use without well-designed visualization tools and dashboards that smartly represent and show the vast amount of data to enable insights and actions. The grid analytics platform should be built on a versatile and scalable architecture that seamlessly integrates with existing utility data sources. It should have a modular design allowing stakeholders to access specific features and functionalities based on their business and technical needs.

Basic Grid Analytics Architecture
Using the GIS system as a data source on assets and network connectivity with an advanced data analytics approach will enable offering solutions that use a combination of both other data sources, e.g., AMI and SCADA, and advanced analytics. These solutions could further improve the accuracy of the network topology, and connectivity model (e.g., customer to the transformer, feeder, and phase) on the utilities existing GIS system, without the need to conduct the expensive site surveys physically. Furthermore, other use-cases could also be developed for the assessment of Distributed Energy Resources (DER) for connection requests. In this case, the connection team and planners could directly use the GIS system without the need to externally use a separate platform as a User-Interface (UI).
As the volume and complexity of data continue to increase, utilities will need to adopt a more refined analytics approach. It is imperative for utilities to use advanced tools and solutions for data quality assessment and monitoring, data cleansing and integration, data management, processing, and advanced analytics to manage their smart grid more effectively.
.png?width=774&height=812&name=Master%20final%201%20(1).png)