- 2026-Jun-04
Espen Berg
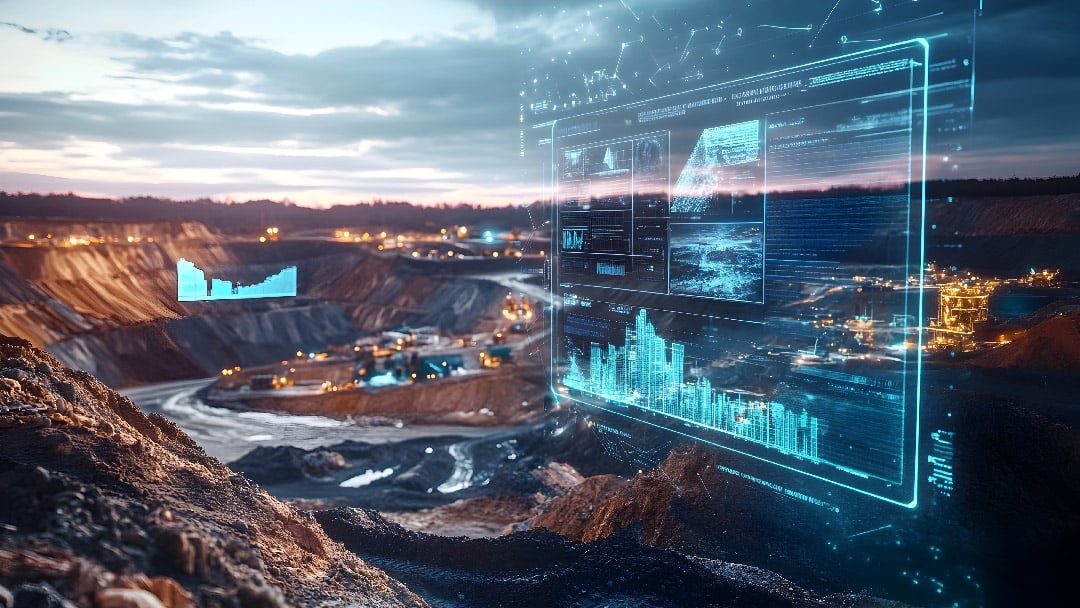
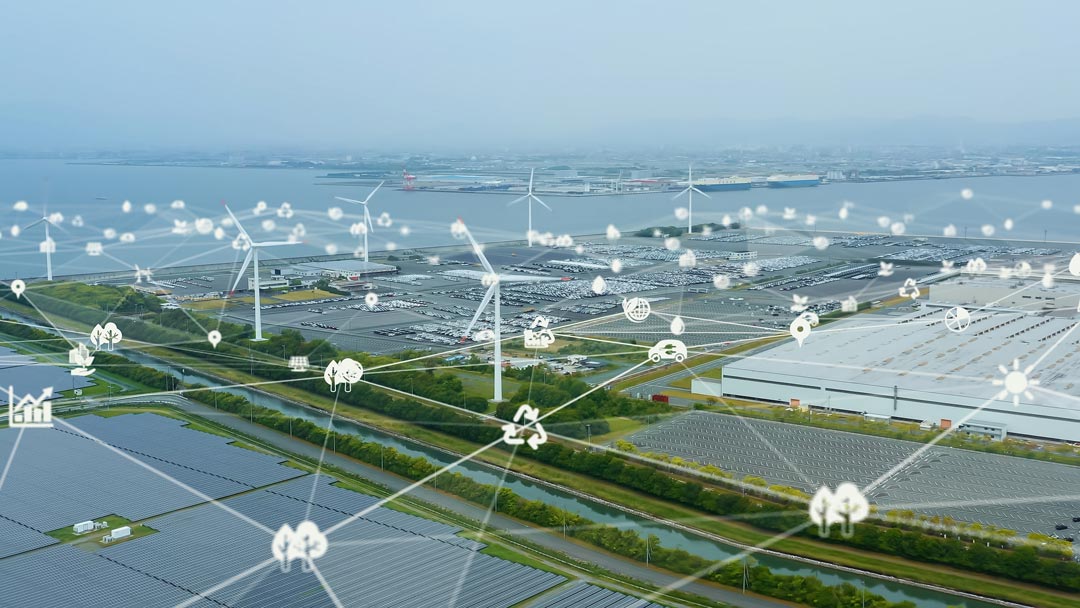
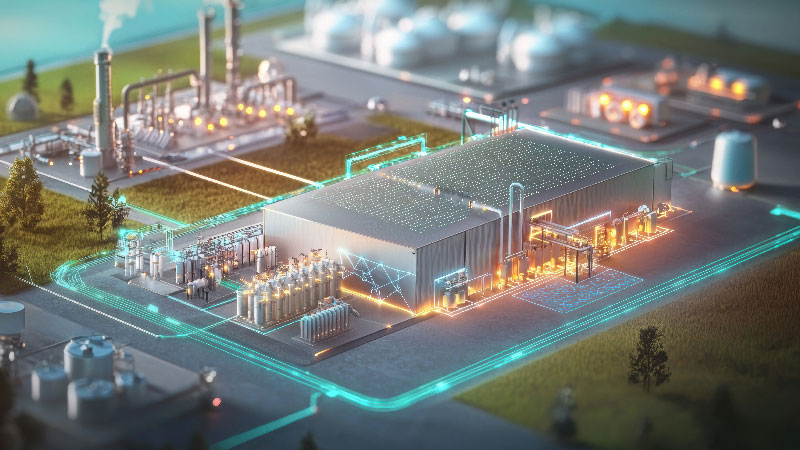
Our Intelligent Engineering solutions across products, plant and networks, combine our engineering expertise with advanced technologies to enable digital engineering & operations, develop autonomous products & platforms, and build sustainable energy and infrastructure
.png?width=774&height=812&name=Master%20final%201%20(1).png)
Having moved to Japan from Finland about a year ago, I have been living and working here since. While I have long been fascinated by the country, having first visited in 2004, I had not really thought about its energy landscape until preparing for this assignment.
I wanted to give an overview of the energy system here, but quickly realised that it would take more than a single blog post, so I decided to split it into more manageable parts. In this first piece, I will start from the basics: CO₂ emissions and where they come from. Note that for the sake of simplicity I am not even including total greenhouse gas (GHG) emissions, which also account for methane, nitrous oxide, fluorinated gases and more.1
Globally, energy-related CO₂ emissions are now at a record high of 37.4 billion tonnes per year in 2023. That is the scale we need to shrink to net-zero over the coming decades. Net-zero does not mean no CO₂ emissions at all but cutting emissions as much as possible and balancing the rest by removing an equal amount from the atmosphere (e.g., by carbon dioxide capture and storage, CCS).
Currently, countries are approaching the net-zero target in different ways. To explore this, it helps to look at present and historic CO₂ emissions by sector. The figure below shows Japan’s CO₂ emissions by sector over the past decades. While this may seem small compared to global emissions of about 37,400 Mt CO₂ per year, Japan’s share of around 3 percent still makes it the 5th largest single emitter in the world, meaning that the choices being made here can have a significant impact.
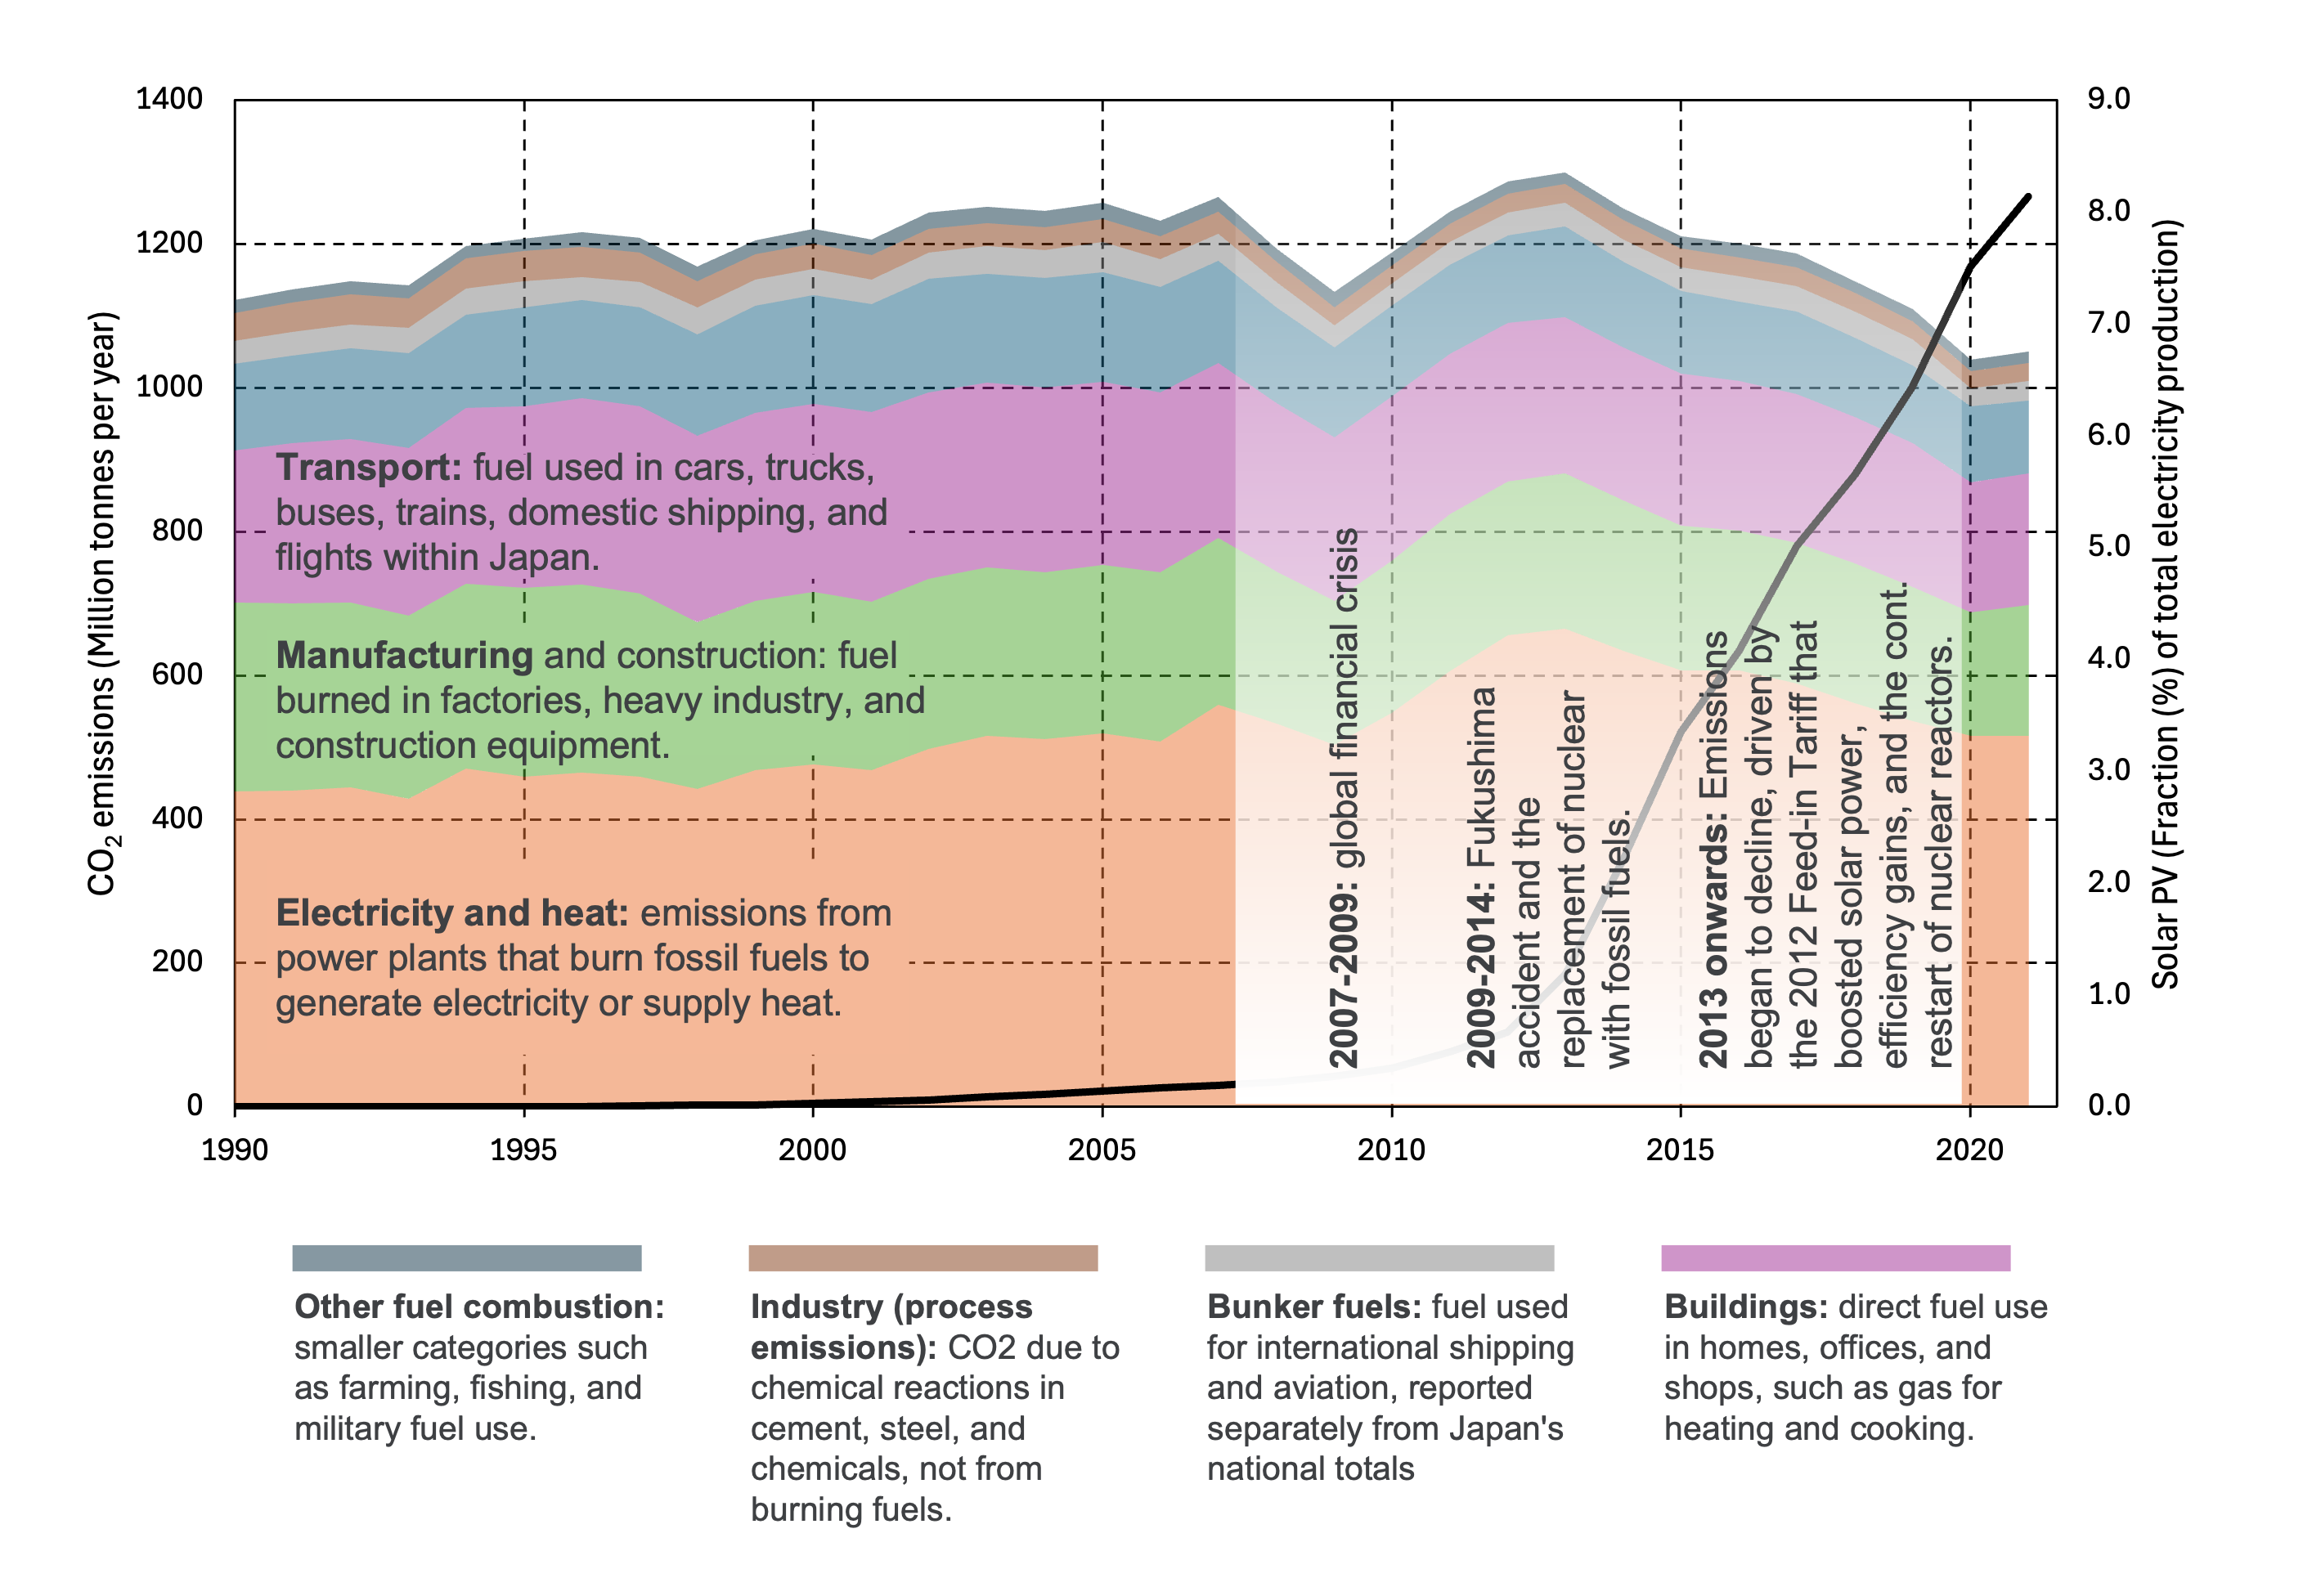
Looking at the figure, emissions were fairly stable from the 1990s up until the recession around 2008, when they dropped as industrial activity slowed. From 2009 onwards the trend shifted, with two major events shaping the curve. First came the Fukushima accident in 2011, which led to the shutdown of nuclear power and a sharp increase in fossil fuel use. This pushed emissions up to a peak around 2013. After that, emissions began to decline again, driven by the rapid expansion of solar power under the 2012 Feed-in Tariff, efficiency improvements, and later the gradual restart of some nuclear reactors.
The figure does not capture the very latest years, but other data shows that renewables continue to grow while fossil fuel use and emissions decline. In fact, if clean electricity expands at the pace seen since 2019, and fossil fuels contract at the same rate, clean electricity could surpass fossil electricity in Japan by around 2033. Still, not all emissions can be solved by switching fuels or adding renewables. Some, especially those from industrial processes like cement and steel, are harder to abate and will require other solutions such as new processes or carbon capture.
It is worth noting that the “electricity and heat” category (referred to in the Figure) in Japan is almost entirely electricity, since district heating is rare and limited to a few northern cities. The data in Figure 1 shows how big impacts events such as Fukushima and policies like the solar feed-in tariff can make.
In my next post I will look at Japan’s plans to reduce emissions further and move toward net-zero, and how these plans differ from many other countries because of the unique constraints and landscape Japan operates in. For me as an engineer, this is also where Cyient’s experience comes in. Much of our legacy in power plant and industrial engineering is directly transferable to today’s challenges, from renewables integration to carbon capture and solutions for hard-to-abate sectors. These are complex problems, but they are also the kind of problems engineers like to solve. Stay tuned for the next blog.
About the Author

Johan Fagerlund (DSc, Tech) leads plant engineering delivery at Cyient Japan, focusing on sustainability and energy transition. As Global Energy Transition Manager, he drives decarbonization strategies across infrastructure sectors. With a doctorate in technology, Johan combines deep engineering expertise with a commitment to building a cleaner, more resilient future